15 Web Design Statistics Every Business Owner Should Know
Websites have become mandatory for all types of businesses. You can get a website by simply hiring a good web design agency. Or, if you have the time, you may use a DIY platform to build one for yourself.
Even if you are not building your website on your own, there are a few web design facts that you should know.
Sure, your website designer will do their best to make your site user-friendly and conversion optimised. But it never hurts to have some basic know-how about web design best practices yourself.
In the web design industry, data often gives better insights than intuition, so we have collected some of the most recent web design statistics and compiled them for you below.
General web design statistics
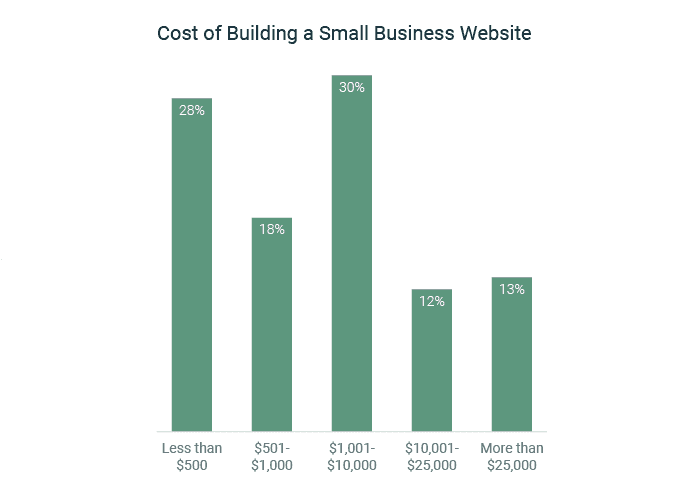
1. Around 30% of small businesses spend between $1K to $10K for website design. The average cost of designing a large business website with essential features is $32K. And the average time it takes to design such a site is 2 months.
Then there are many (around 28%) small business owners who spend even less than $500 for their websites. The cost depends on what type of site you want. 38% of small businesses don’t have any website at all. (Source)
2. According to a worldwide study by Adobe, given 15 minutes of time, 59% of people will read or browse through something beautifully designed rather than something plain and boring. You may think a plain and simple design would be great for your website. In reality, however, most of your visitors will prefer attractive design over simplicity. (Source)
3. A visitor takes only 50 milliseconds to form an opinion about your site. So if your site design doesn’t form a good first impression, a lot of your potential customers will simply leave.
4. According to a 2018 industry survey by Econsultancy and Adobe, 84% of respondents think that design-driven businesses are outperforming their competitors. 73% of companies are investing in design to differentiate their brand from others. No matter what type of business you have, you need a visually attractive website to impress your customers. (Source)
Site UX design stats
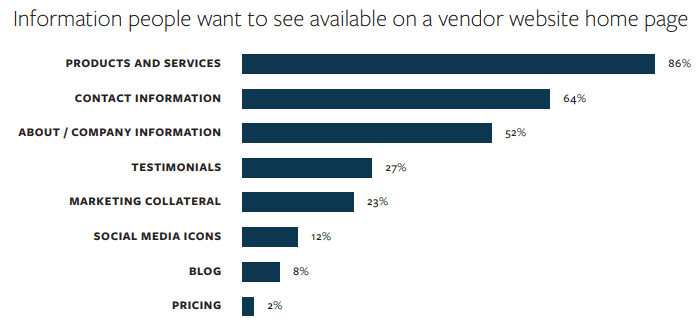
5. Once visitors come to the homepage of your site, 86% of them want information about your products or services. 64% expect to have your contact information and 52% want to know about your business. You should keep these figures in mind when designing your homepage. (Source)
6. 36% of website visitors click on your logo to reach your homepage from other pages. Thus it is a fairly common practice to place the logo on the top left corner. (Source)
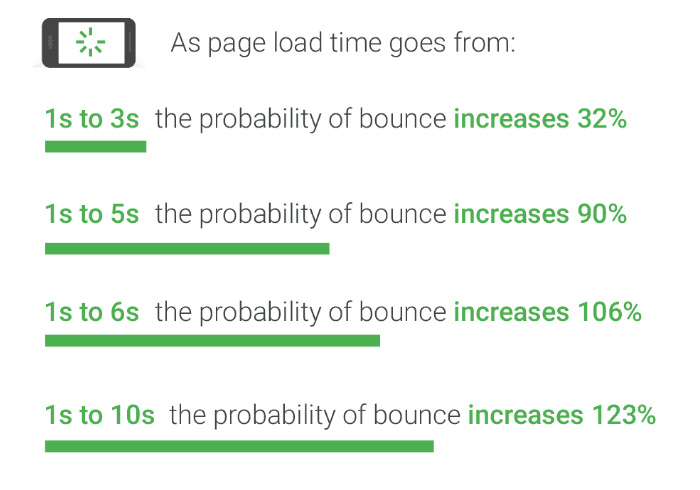
7. 53% of mobile visitors leave a site if it takes more than 3 seconds to load. If your site load time goes from 1 second to 3 seconds, the probability of bounce increases by 32%. Unfortunately, the average time it takes to fully load a mobile page is still 15 second. As mobile traffic is responsible for more than 50% of web traffic, site speed should be a primary concern for web designers. (Source)
8. While people like sites which are beautifully designed, they tend to avoid sites which are bloated and feature too many elements. As the number of page elements like images, text or headlines increases from 400 to 6000, the probability of conversion drops by 95%. Overcrowding a site with a lot of elements is the most common web design mistake made by SMBs. (Source)
9. Key reasons visitors may stop engaging with your site;
- Images are not loading (39%)
- Page takes too long to load (39%)
- Page content is too long (38%)
- Content is visually unattractive (layout and imagery) (38%)
(Source)
10. Voice search and wearable technologies are two growing channels through which customers are going to interact with your website. 38% of consumers are interested in using a voice assistant (like Google Now or Siri) and 25% want to try wearable devices for online interaction. It’s high time to optimise your website’s design for voice searches and wearables. (Source)
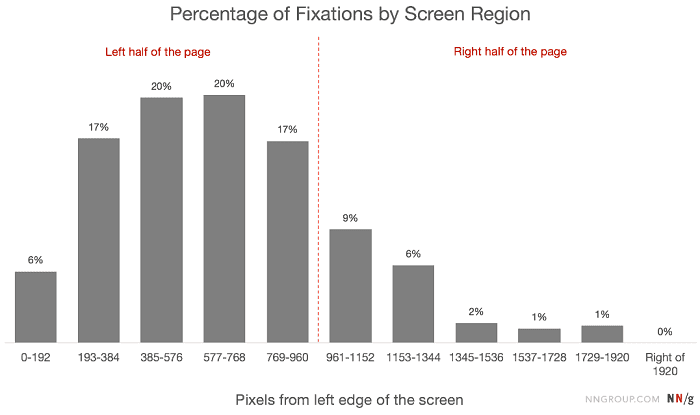
11. On average, visitors spend 80% of their time viewing the left half of the page and 20% viewing the right. For a desktop site, the area 400 pixels away from the left edge gets the most viewing-time. (Source)
Ecommerce web design statistics
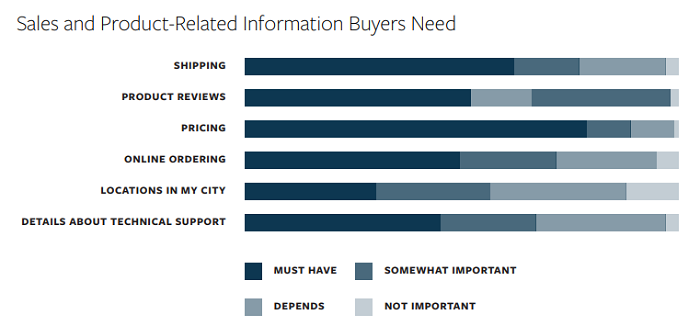
12. For an ecommerce product page, the most important information to include are pricing, shipping information and product reviews. 78% of customers think pricing is a must-have for any product page, 62% think shipping details are essential and 52% look for product reviews. These web design statistics should be kept in mind when designing your product page. (Source)
13. Your site must show an overall business rating and customer testimonials on the homepage. 85% of customers trust online reviews and testimonials as much as personal recommendations. (Source)
14. 45% of all ecommerce purchases will be through mobile devices by 2020. So it’s not enough to make your site responsive, you should also make sure that customers can actually purchase products comfortably from your site while using a small screen. (Source)
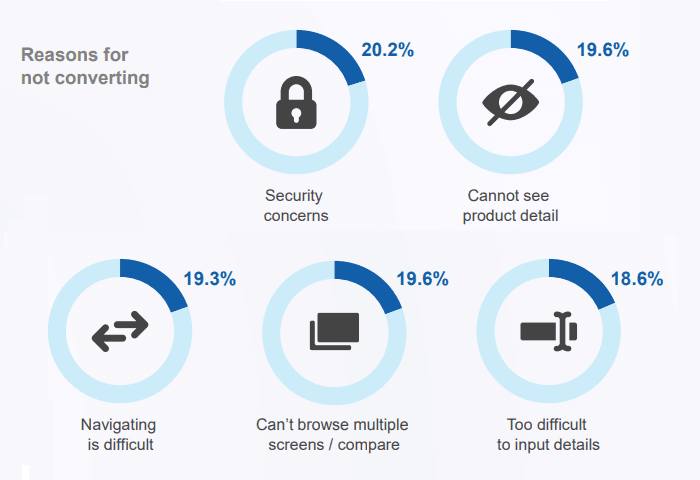
15. The main reasons people don’t buy from your mobile ecommerce site are;
- Security concerns (20.2%)
- They can’t see product details (19.6%)
- Navigation is difficult (19.3%)
- They can’t browse multiple screens to compare (19.6%)
- It’s too difficult to input details (18.6%)
Your web design strategy must address these issues. (Source)
Conclusion
The most important characteristic of a successful website is user-friendliness. If you can align what your visitors want with your business’ goals, it shouldn’t be difficult to convert them. The web design statistics we’ve explored above will give some insights in that regard.
If your business needs a new website which follows the best practices from the latest industry researches, feel free to contact our web design Melbourne team to get a free quote.
References
Small Business Websites in 2018 (Clutch.co survey)
Digital Intelligence Briefing: 2018 Digital Trends Report (Econsultency and Adobe)
Web Design Stats and Trends for Small Businesses (Goodfirms Research)
Local Consumer Review Survey 2017 (BrightLocal)
The 2015 B2B Web Usability Report (KoMarketing)
Mobile’s Hierarchy of Needs 2017 (comScore Whitepaper)
https://cxl.com/blog/first-impressions-matter-the-importance-of-great-visual-design/
Achieving Deliciousness: Adapting to an increasingly content-hungry world (Adobe survey)
New industry benchmarks for mobile page speed (Think with Google 2018 report)
Horizontal Attention Leans Left (Neilsen Norman Group research 2017)
You read a lot. We like that
Want to take your online business to the next level? Get the tips and insights that matter.